Starting a New Analysis
Click Upload Binaries on the home screen and select your firmware binary. Metalware automatically configures and starts fuzzing. The default analysis duration is 24 hours, configurable from the dashboard.
Coverage
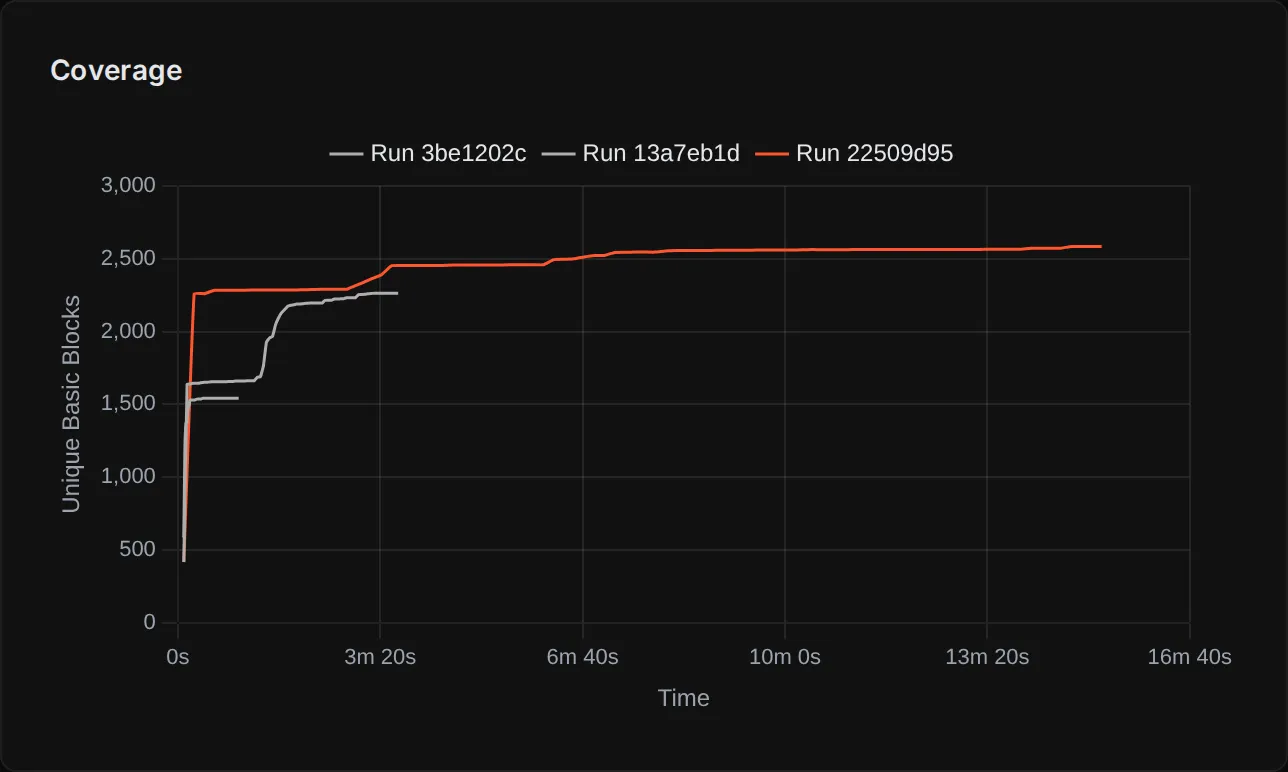
Section titled “Coverage”Coverage Plot
Section titled “Coverage Plot”The Analysis Page shows a coverage plot tracking unique basic blocks discovered over time, with one curve per run. You may see multiple runs because Metalware automatically restarts the fuzzer as it learns about the firmware (e.g., discovering new DMA configurations or missing memory regions), carrying forward all previous progress.
Coverage in Your Decompiler
Section titled “Coverage in Your Decompiler”The Ghidra and Binary Ninja plugins overlay coverage directly onto the disassembly, so you can see which functions and basic blocks the fuzzer has reached.
Defects
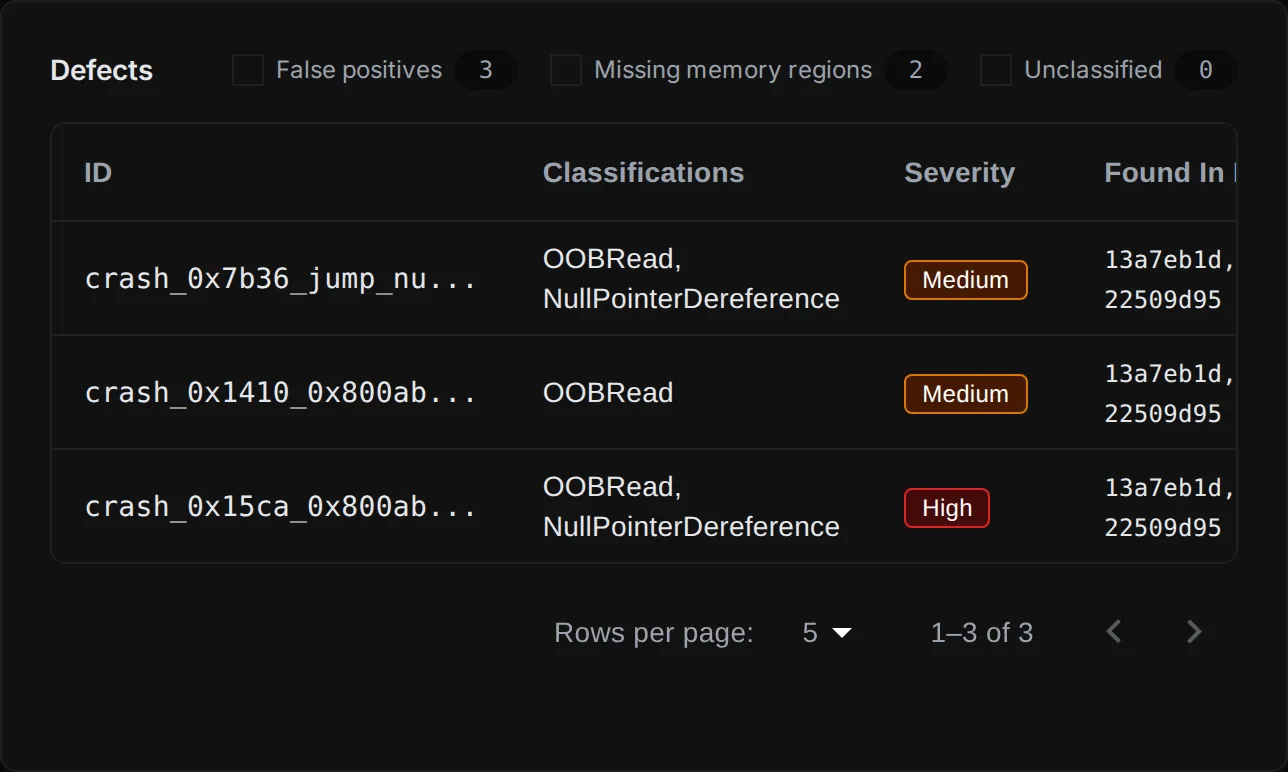
Section titled “Defects”Defects appear on the Analysis Page as they are discovered, classified by type and severity. Each defect includes a stack trace, root cause analysis, and a downloadable PDF report.
See Investigating Defects for debugging tools and workflows.