Investigating Defects
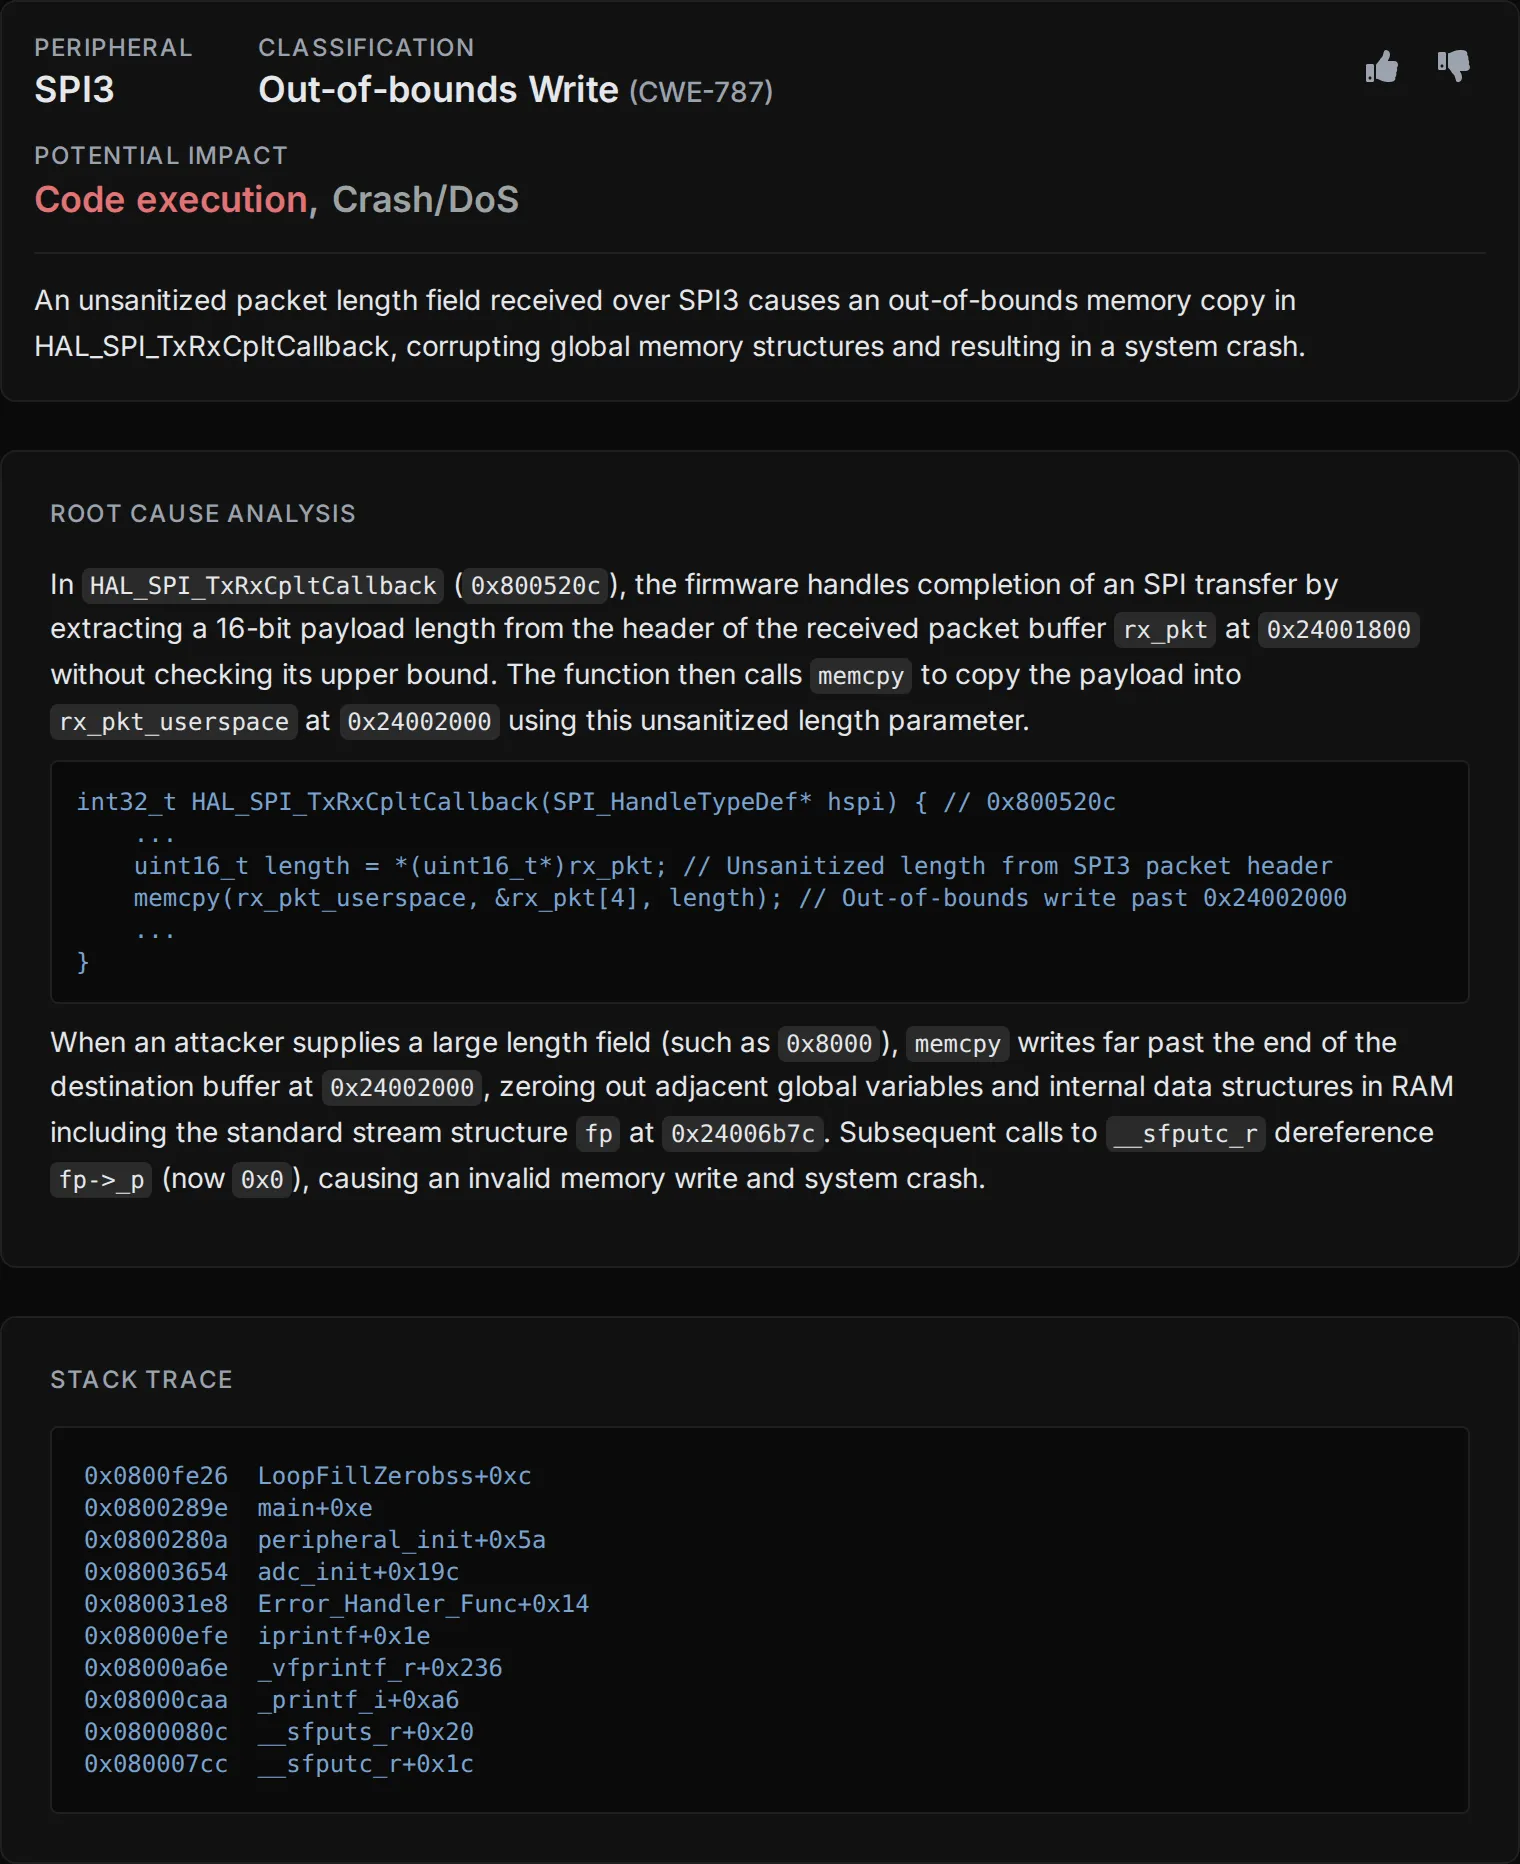
When Metalware discovers a defect, it appears on the Analysis Page with a classification. Select any defect to see its full details, including a root cause analysis and stack trace.
Debugging Tools
Section titled “Debugging Tools”Three debugging tools are available for reproducing and investigating defects: the Ghidra plugin, the Binary Ninja plugin, and remote GDB.
| Feature | Ghidra | Binary Ninja | GDB |
|---|---|---|---|
| Time-travel stepping | Yes | Yes | Yes |
| Register/memory inspection | Yes | Yes | Yes |
| Breakpoints/watchpoints | Yes | Yes | Yes |
| Coverage overlays | Yes | Yes | No |
| MMIO stream visibility | Yes | Yes | No |
| Taint analysis | Yes | Yes | No |
Ghidra Plugin
Section titled “Ghidra Plugin”For installation and usage, see the Ghidra plugin repository.
Binary Ninja Plugin
Section titled “Binary Ninja Plugin”For installation and usage, see the Binary Ninja plugin repository.
GDB is useful if you don’t have Ghidra or Binary Ninja, or if you need to script your debugging session. Install the Metalware CLI (uv tool install metalware) and run metalware setup so it has the server URL and API key.
-
Select GDB Debug from the Actions pane.
-
Copy the command from the dialog and run it locally. It looks like:
Terminal window arm-none-eabi-gdb -ex "target remote | metalware gdb --run <run_id> --testcase <testcase_id>"The CLI authenticates and tunnels GDB through the Metalware API. There is no host:port to connect to.
-
After GDB connects, load your binary:
file myfirmware.elf
Monitor Commands
Section titled “Monitor Commands”| Command | Description |
|---|---|
monitor help |
List all available commands. |
monitor reset |
Reset the VM to its initial state (equivalent to a JTAG reset). |
monitor icount |
Print the current instruction count. |
monitor back |
Step back one instruction. |
monitor step N |
Step forward N instructions. |
monitor goto N |
Jump execution to instruction count N. |
monitor backtrace |
Print the current call stack. |
monitor snapshot |
Save the current VM state. |
monitor restore |
Restore the VM from a saved snapshot. |
monitor pcode |
Show the P-code IL for the current instruction. |
monitor memory-map |
Print the memory layout. |